Revlyty
Internal Product
Product Design, Analytics Dashboard, Frontend Development
Product Designer, Frontend Engineer
2026
Ongoing
Introduction
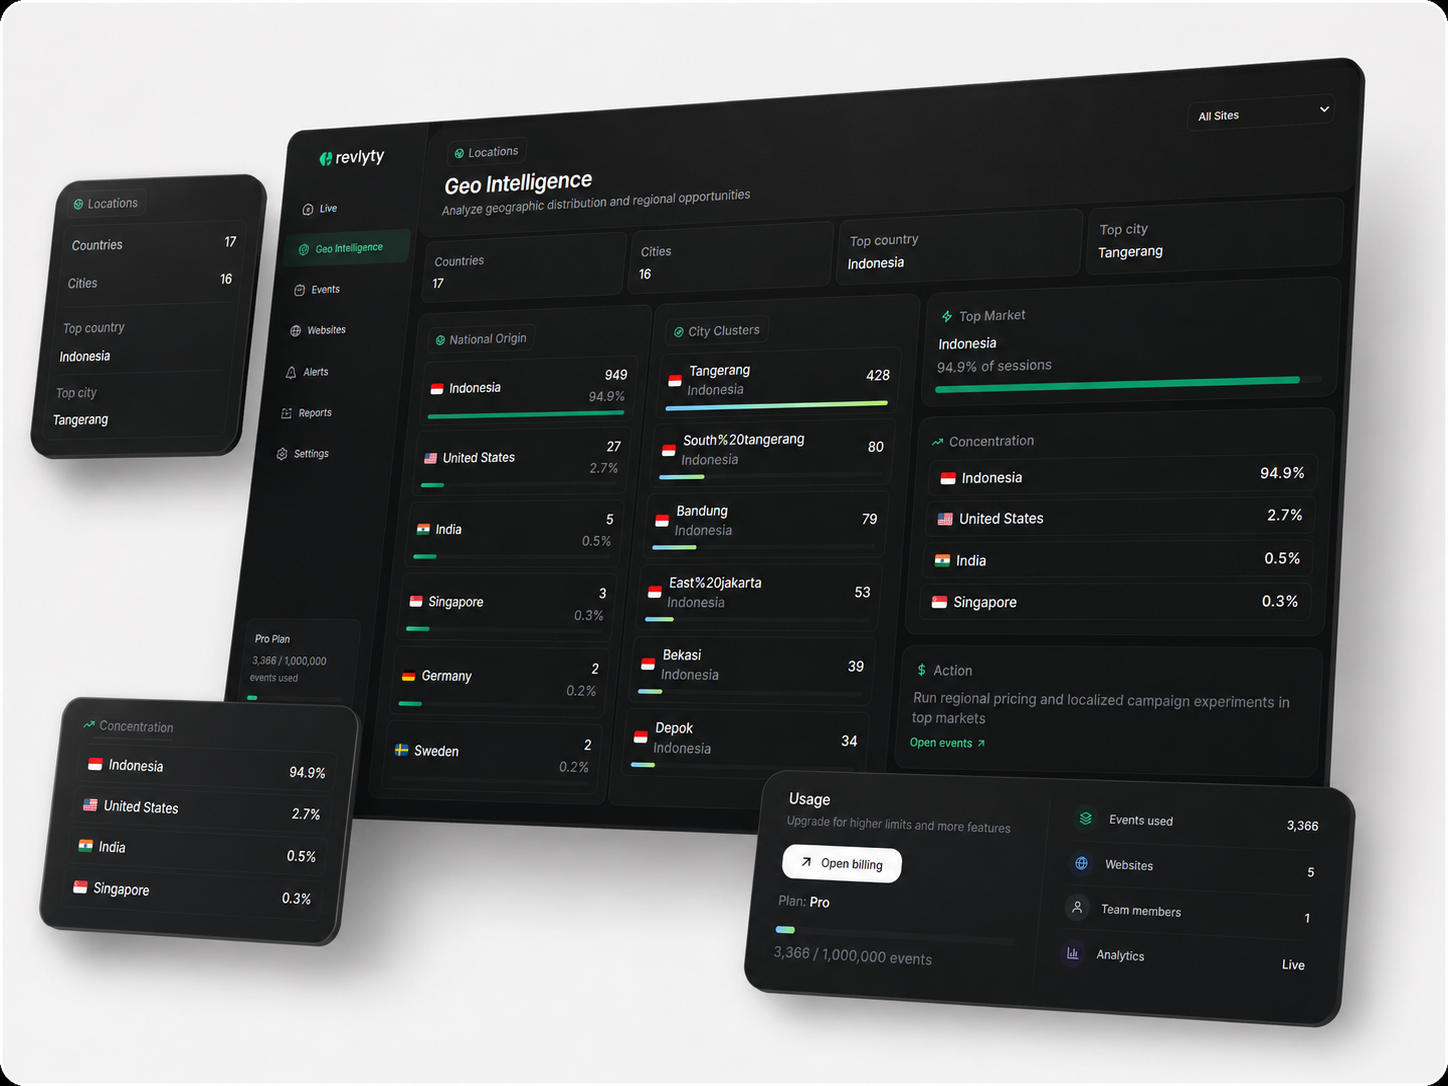
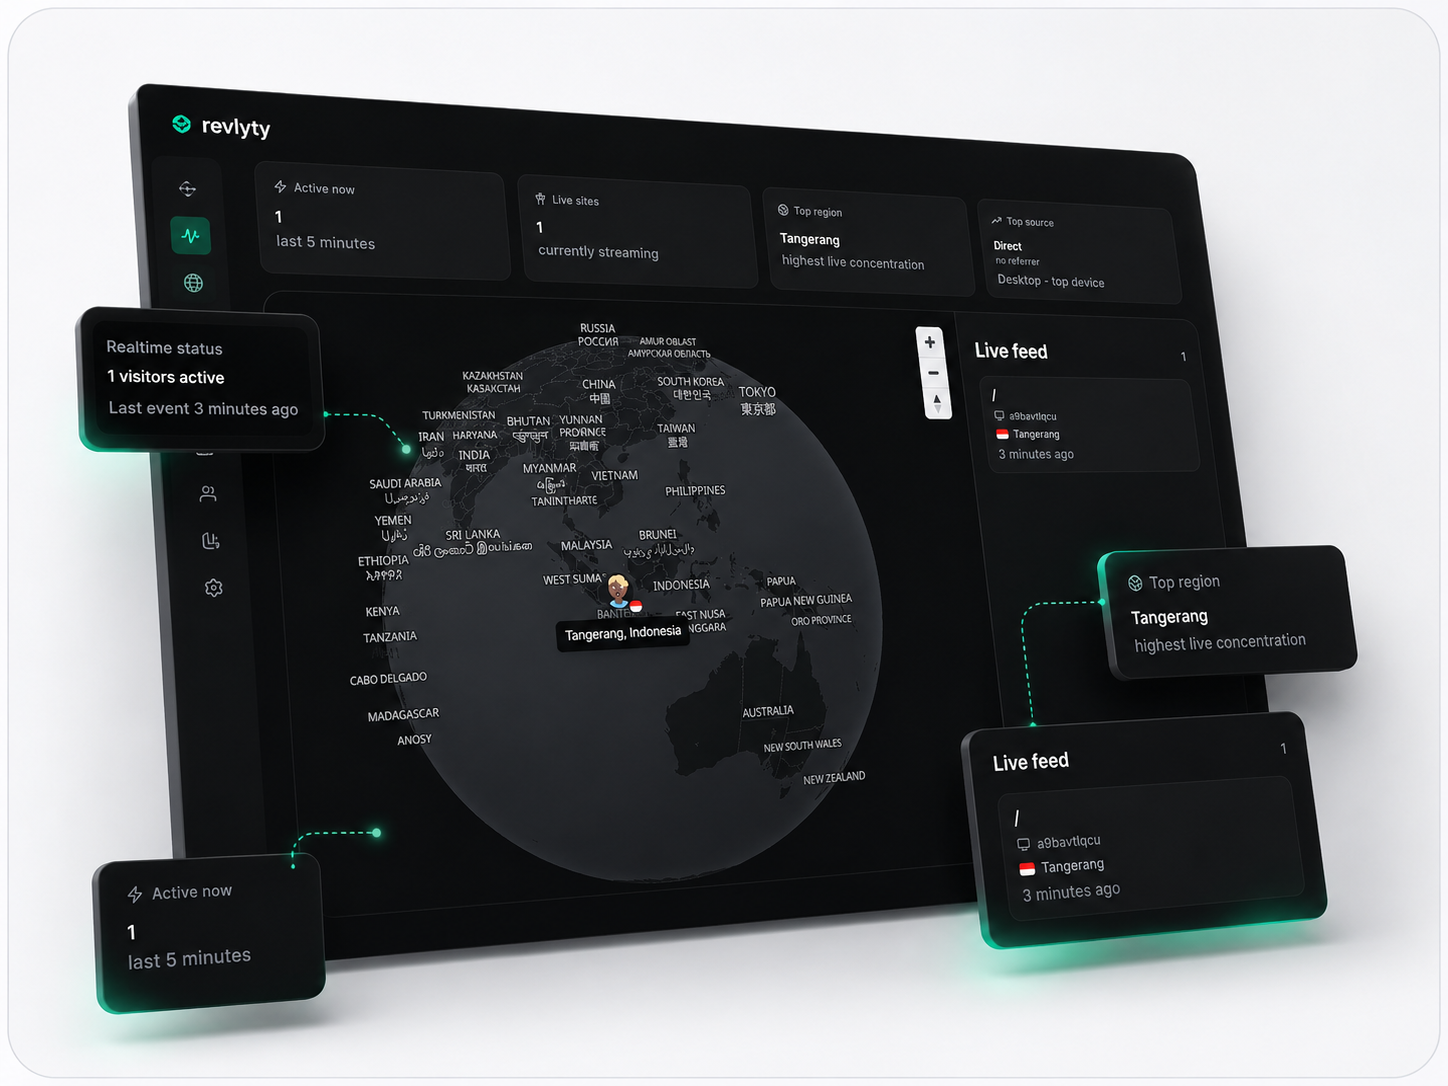
Revlyty was created as a lightweight analytics workspace for understanding how a website performs after it goes live. Instead of showing raw numbers without context, Revlyty organizes traffic into a cleaner view: link performance, active users, sources, browsers, devices, locations, events, and activity patterns. The goal was to make analytics feel focused, visual, and useful without overwhelming the user.
Execution
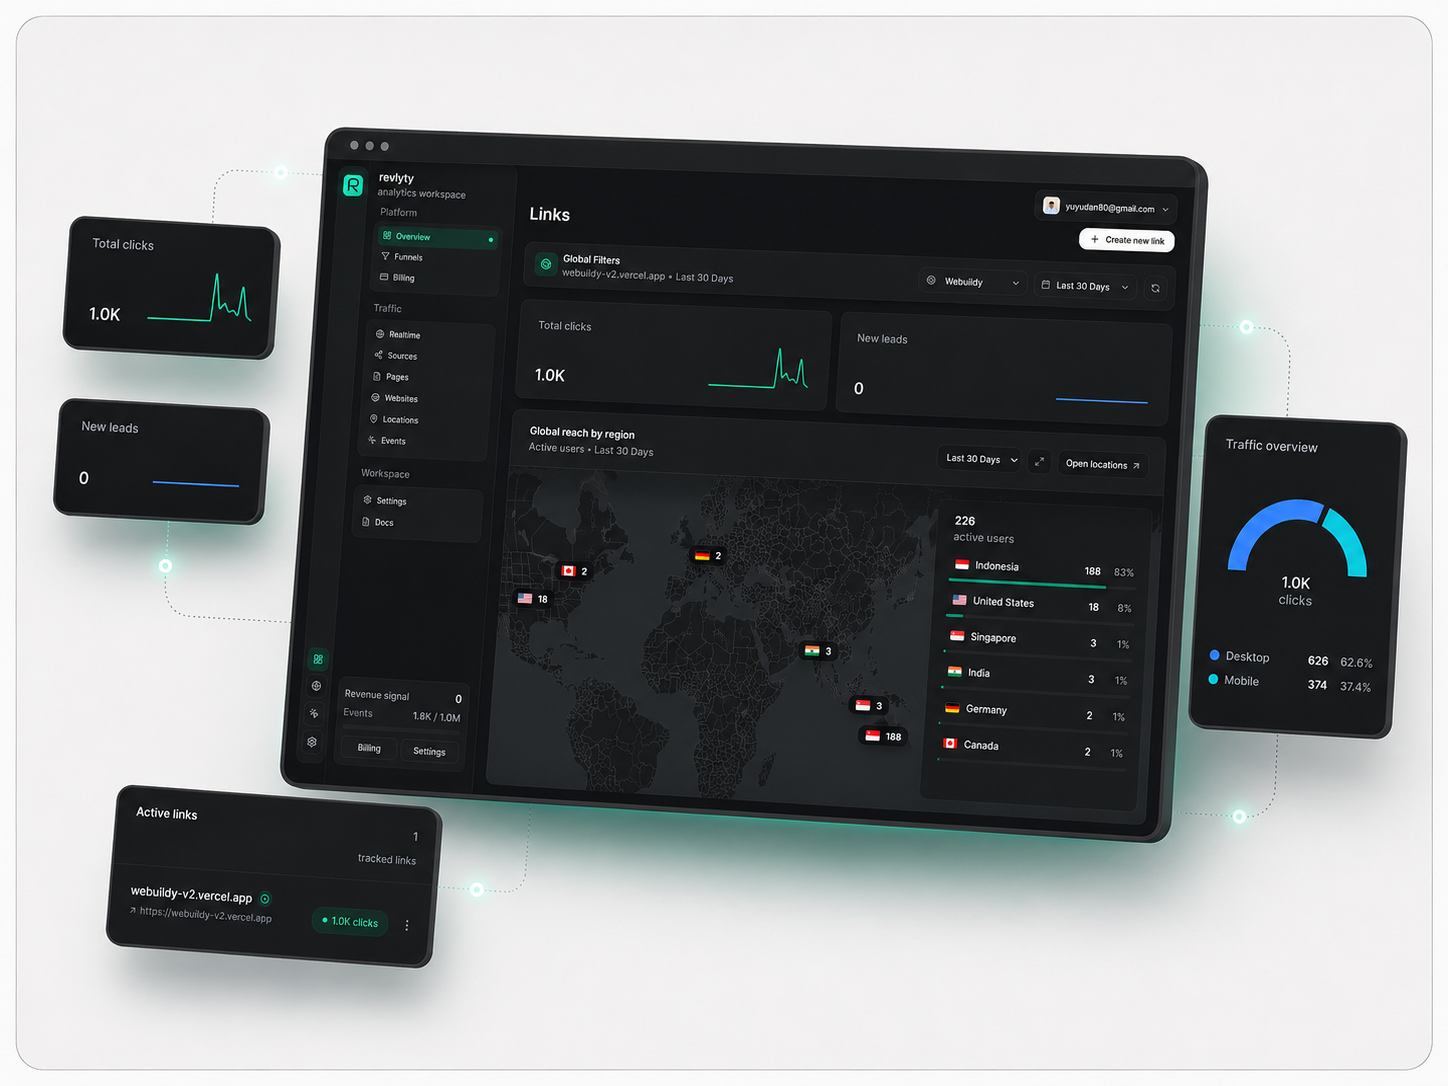
The interface was designed around a dark command-center layout with a persistent sidebar, compact metric cards, and clear traffic sections. I built the experience around several core views: global filters, total clicks, new leads, active links, region tracking, activity heatmap, device breakdown, traffic sources, and browser analytics. The visual system uses dark surfaces, subtle borders, emerald highlights, and compact cards to create a workspace that feels technical but still readable. The biggest design challenge was making analytics feel dense without becoming messy. Every card needed to carry information while still maintaining enough breathing room.
Results & Impact
Revlyty became a focused analytics product that helps turn traffic into visible insight. The project strengthened my ability to design data-heavy interfaces, manage dashboard hierarchy, and create technical UI systems that still feel polished. It also became a useful companion product for tracking real projects like Webuildy.
1.0K clicks
A compact view of link activity over time.
226 users
Traffic grouped by region and country.
6 dimensions
Sources, browsers, devices, locations, pages, and events.